[Project] How to easily monitor your plants’ soil humidity
You came here to learn about soil humidity monitoring, right?
Then you should probably scroll down to the part where I have a photo of my setup. However, if you have the time and feel like reading some of my ramblings, why don’t you just continue with the next paragraph? I promise you won’t be disappointed!
My beginning as an urban farmer
Spring is here and with it comes the sunshine, even in rainy Netherlands. For this reason I recently started growing all kinds of things at home. First I started with some of those tiny thumb-sized vases which come bundled with sunflower and lavender seeds but… soon after, I realized those vases were not gonna be big enough to hold that many seeds. Determined to see those plants through to flowering, I started buying bigger vases and soil. Soon after that, I was growing not only the sunflowers and lavender but I sowed some seeds I had bought a long time ago. I was now growing several shoots of mimosa pudica (aka the shy plant, famous for the fact that it closes its leaves when you poke it – which you can see on Youtube), a few more seedlings of chinese chives (or scientifically speaking, allium tuberosum, delicious in many dishes) and my proudest plantation, seedlings of the hottest pepper in the world: the trinidad moruga scorpion, which in the the Scoville scale is said to be approximately 500 times hotter than your average Jalapeño or Chipotle chilli. Now THAT’S spicy!
You like the post so far? Well keep on reading then!
Okay, I became a farmer.
Yeah okay, I didn’t start farming because the weather was nice. Most people who face the same circumstances will just go to the beach or do a barbecue or just have a beer with friends in the sunshine but… I realized I like farming. In a more and more brick and mortar world where everywhere there’s buildings and cars and in a world where more and more the artificial replaces the natural, it is nice to have a small piece of nature close by.
At this point I had a substantial collection of vases and it didn’t take me long to realize that I sometimes would forget my plants and the soil would be bone dry. Whilst plants make for great landscape, they are very unobtrusive and don’t exactly ask for water the same way my cat used to. So I decided to put my skills to good use and do something about it. After some browsing on eBay I found the perfect tool for the task: soil moisture sensors. It is important that you realize that these sensors are nothing but metal plates with a silicon coating so don’t expect anything too fancy and always remember the adage: you get what you pay for.
The sensors themselves are pretty useless but I had a few Raspberry Pi boards laying around so I started investigating whether it would be possible to take analog readouts with it, which, to my dismay, was not possible. At least not without using a USB soundcard (it’s pretty ingenious actually… when you think of it, what’s sound if not analog current waves at different frequencies?). So I decided to be more professional and bought an old friend of mine: an Arduino Nano board which can take all kinds of readouts. It does have however the inconvenient of not being able to push the readouts anywhere. You can’t connect it to a network which means you can’t exactly take the data out into a database and plot it without additional devices and so the Raspberry Pi came to rescue!
Time to join the forces of my inner farmer and inner nerd together!
What was my goal then? I wanted to build a setup that would allow me to plot a nice graph with a live readout from my plants’ soil humidity. Two problems there: to plot a graph you’ll need to store the data somewhere and… with the cheap soil moisture sensors I had bought, “live” was not going to be possible. This is something I cannot stress enough: if you’ll use the same sensors as me, do NOT leave them powered for longer than what is needed to take the readout. Below in this post I explain why.
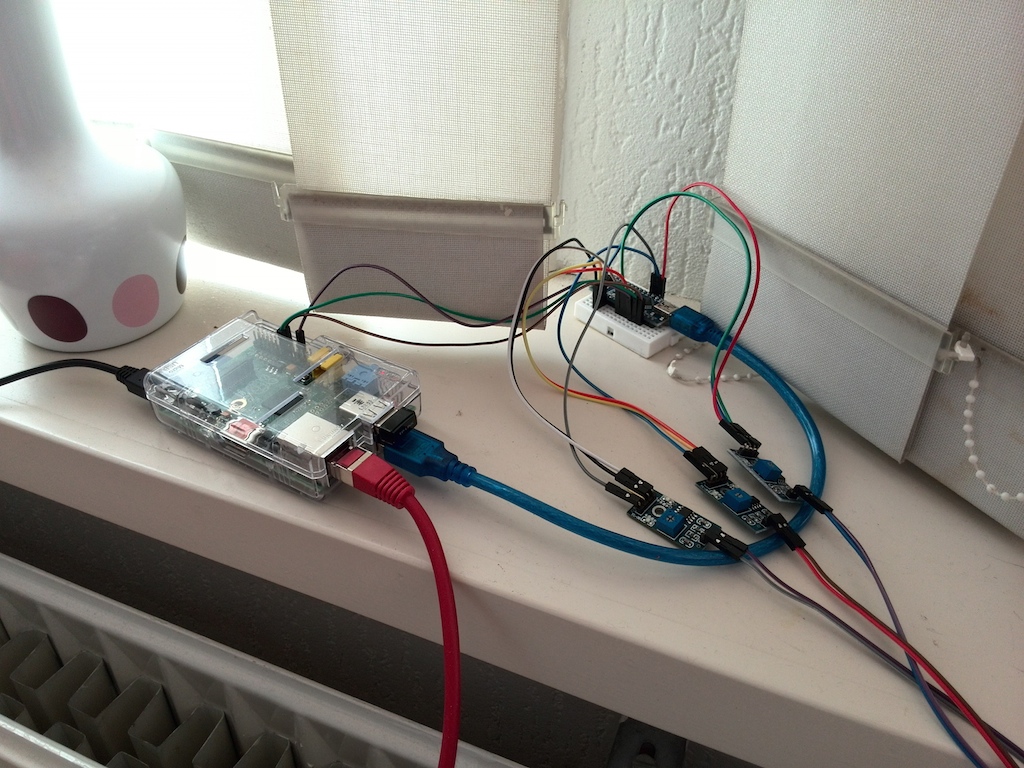
So in the end, I setup the following (photo below):
– Raspberry Pi, connected to my home network (the red UTP cable).
– Arduino, plugged to the soil moisture sensors and connected via USB to the Raspberry Pi.
Then with some of my rusty C code I was able to get the Arduino up and running and sending data back to the Raspberry Pi.
At this point please understand that there are a multitude of ways in which the exact same thing can be achieved. This is just what I came up with after experimenting with a couple of ways.
In essence, what I have is: three DuPont cables going from separate digital pins on the RPi which in turn connect to separate digital pins on the Arduino Nano. The Arduino Nano has one digital pin per soil moisture sensor (which is plugged to the VCC in each of the small devices on the right… they are YL-38 sensors and are explained later) and one analog pin also per soil moisture sensor (plugged to the A0 in the same YL-38 devices, to take the soil moisture readings).
The idea is that periodically the Raspberry Pi will send a signal to the Arduino on a specific digital pin which will then cause the Arduino board to power the small bridge device which in turn outputs an analog readout (essentially an AC wave) which the Arduino listens on and prints to the serial console.
FRIENDLY ADVICE: After reading around, I learned it is best to do this for short periods of time – namely, not for longer than just a few seconds. If you keep the bridge device powered at all times, your sensor probes will rust within the hour due to the electrolysis which the DC current will cause to the plates. After that happens, your sensor is pretty much garbage as the sensor probes will have corroded and the moisture readouts will have become inaccurate.
Also of note is how the readings might fluctuate just after you powered the sensor. For this reason it is wise to take a series of readings (I take 20) and discard the first few (I discard the first half). Then you might as well just store a burst of readings which you can later plot into a graph.
What do you need exactly?
My goal is to merely give you the idea and the very general pointers of how to get around doing something like this. It’s most definitely not difficult and anyone with a basic understanding of electronics can get it up and running in a matter of hours. This was a lot of fun for me to figure out myself and for this reason I will not publish the code but merely give you, the reader, a general idea of what has to be done. With this and some programming knowledge, you should be able get this up and running in no time. Here’s a very general walkthrough:
- Get both a Raspberry Pi and an Arduino board. It doesn’t matter which Arduino. There’s many different types and I’ve chosen the Nano variant because it strikes a great balance between functionality and form-factor.
- You’ll also need a breadboard and DuPont wires. You can get these cheaply off eBay and I found that for most of these usages, male to female cables are ideal (the male end goes into the breadboard whereas the female end can plug directly into sensors’ pins).
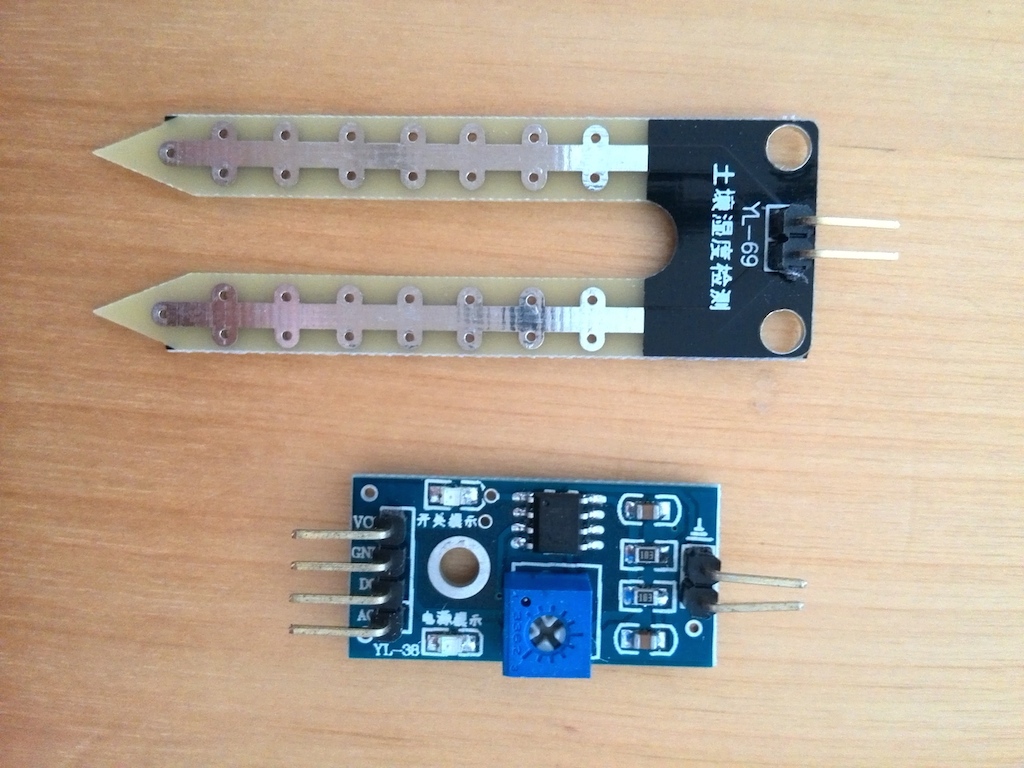
- Obviously you’ll also need soil moisture sensors (photo below). There’s a lot of variety here both in quality and price range. To get started I suggest you look for the cheap kind on eBay where you can get a Chinese-built YL-69 (although I normally just search for ‘soil moisture sensor’) for a little over 2 euro. These sensors also come with a ‘middle-man’ circuit which allows you to get two outputs: one is an analog readout of the resistance between the sensor’s two plates and the second is a digital output (essentially, HIGH or LOW, 5v or 0v) depending on whether the humidity is above or below a threshold which can in turn be adjusted by a built-in POTS. Personally I just take the analog readout and ignore the digital one. This allows me to make pretty graphs like you can see later in this post.

Above, the soil moisture sensor itself (YL-69). Below, the bridge device which you’ll need to use (YL-38).
After you have all the materials, it’s very simple to get started. The YL-69 sensor itself has two pins which need to be wired to the two pins on the YL-38 bridge (specifically, the two isolated pins). On the other end of the YL-38, you have four pins which (top to bottom) represent VCC, GND, D0 and A0. VCC and GND are your power pins which should be set to 3.3/5V and Ground (respectively) and your A0 is an analog output which you will connect to an analog input on the Arduino board (the Arduino Nano has 8 analog pins) via the breadboard.
FRIENDLY REMINDER: DO NOT keep the YL-38 bridge powered for long periods of time. If you leave it permanently on, it will keep applying DC current to the YL-69 sensor which will cause corrosion due to electrolysis. If you want to keep your sensors in good shape for as long as possible, you will only apply power to VCC before you make a reading. Additionally, be sure to at least every week switch the two cables going to the YL-69 sensor as to slow down corrosion as much as possible.
This being said, you’ll want to plug the VCC on the YL-38 bridge to a digital pin on the Arduino board which you will set to HIGH (thus effectively powering the bridge) before making a reading.
When you have the Arduino and the sensors all hooked up, you’ll want to get this plugged to your laptop so you can start experimenting with the code. If you need further help with this part, please drop me a comment or an e-mail (tiagoRemove-me-and-add-at-or-elseEspinha.nl)!
After that’s done, all you have to do is use one of the GPIO pins in the Raspberry Pi as a signal for the Arduino to start a reading. Essentially my (Python) script does the following goes something like:
- This script first sets a GPIO pin to HIGH.
- The Arduino is continuously listening to this pin and once it is raised to HIGH, sets the sensor’s VCC to HIGH.
- The Arduino continuously prints readouts from the sensor to the serial console.
- The Python script is reading the USB output (i.e. the serial console) of the Arduino board and storing the readouts.
- The Python script sends the readouts to my webserver where they are stored in a database.
Obviously, for this to work you’ll need the Python libraries for the Raspberry Pi GPIO and I recommend the Python library for dealing with serial devices.
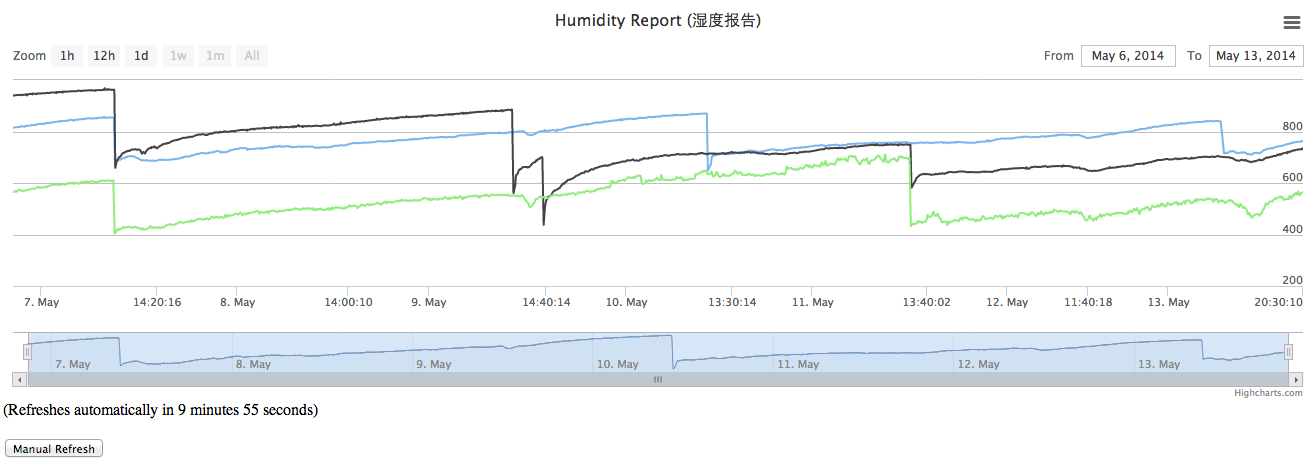
After all’s said and done, I can generate a graph such as this:
 But wait, there’s more!
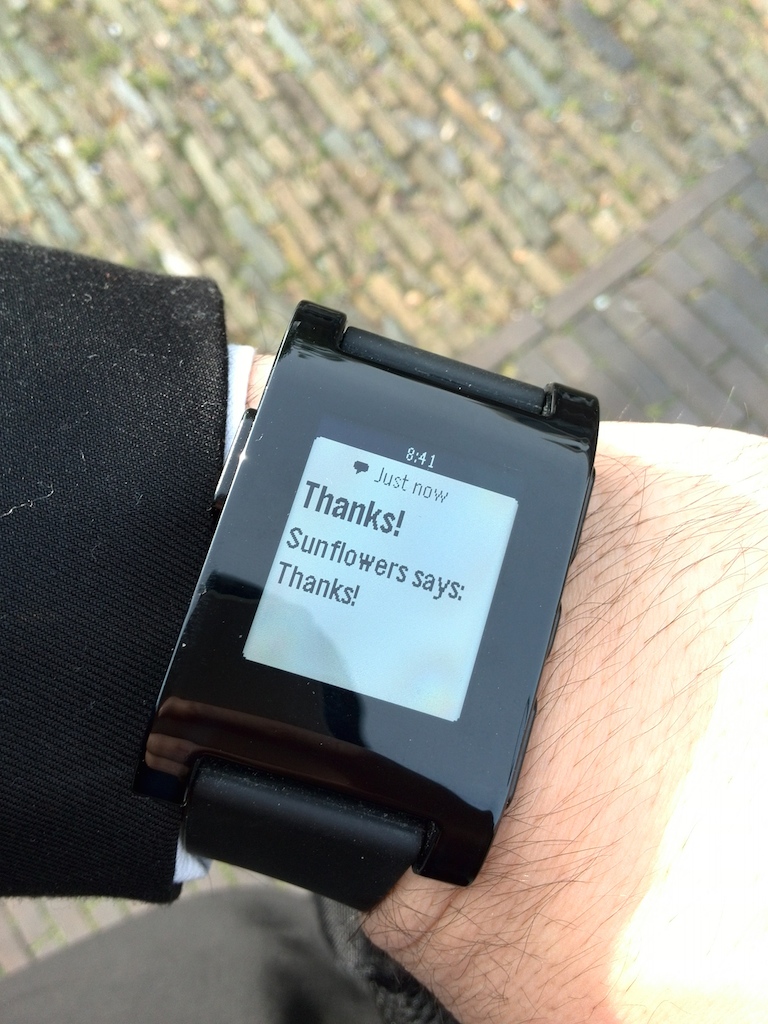
I’m also the proud owner of a Pebble watch, so why not put this to good use, I thought! Everything was already in place so all I had to do was set up an alert system that monitors the last collected data. If it’s above a “drought threshold”, I receive an alert on my Pebble. But there’s still more! As soon as I water my plants, I get another alert as seen below:
To conclude
Thanks for reading all the way here! I hope my post was of some help for you to start in a similar endeavor. I tried to keep the technicalities (scripts, etc) down to a minimum because, well, that was the most fun part of it and I wouldn’t want to spoil any of it for you! However, if you get yourself into some trouble and you need some help to move forward, feel free to drop me a comment or, more wisely, drop me an e-mail. You can reach me at tiagoRemove-me-and-add-at-or-elseEspinha.nl.


Comments